The recent visit of US President Trump to China has continued to escalate the economic and trade issues between China and the United States. As one of the important consumer goods in Sino US trade, the structural changes in the tea market are also worth paying attention to. According to the data on tea imports from the United States, in the first quarter of 2026, tea imports in the United States showed the characteristics of "quantity reduction, price increase, and structural upgrading": the import value reached 152 million US dollars, the highest level in the same period of nearly seven years, with a year-on-year growth of 5.3%; The import volume was 26900 tons, a year-on-year decrease of 9.8%; the average import price rose to $5.63/kg, a year-on-year increase of 16.8%.
Core Highlights:
Tea structure: Green tea has shown outstanding performance, achieving 54.8% of the import value with a quantity proportion of 16.8%, while black tea has experienced a decline in both quantity and price.
Source differentiation: Japan has become the largest source country for tea imports from the United States due to its high-end green tea (mostly matcha); Low price black tea in Argentina and India continues to be sluggish; Mainland China's exports to the United States are showing a trend of "quantity reduction and increase", with an average price increase of 39.0%, leading to an increase in demand for high-quality green tea.
Regional development: California, driven by the demand for high-quality green tea, has become the largest engine of import growth in the United States.
Note: This article is based on import and export data from the United States Census Bureau, compiled by the Tea Industry Branch of the China Association for the Promotion of International Cooperation in Agriculture
1. Overview of Core Data

*The parentheses indicate year-on-year growth
Annual Import Trends

2. Analysis of Import Trading Partners
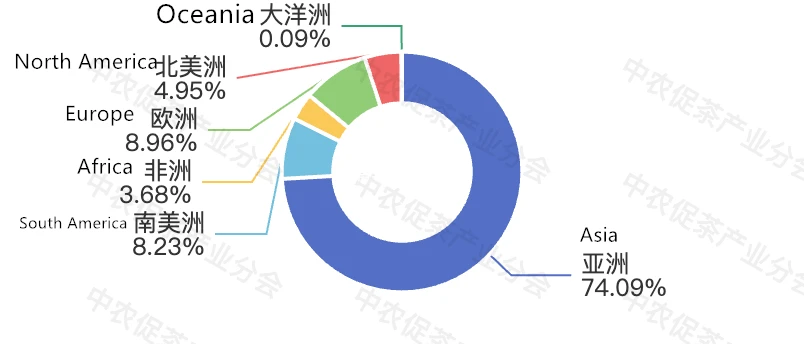
Asia is the largest supplier continent, accounting for 44.81% of imports and 74.09% of total value, and is the core source of tea imports for the United States; South America is the second largest supplier continent, accounting for 37.65% of imports and 8.23% of imports; The proportion of imports from Africa is 10.64%, and the proportion of imports is 3.68%; The import volume and proportion from Europe, North America, and Oceania are all less than 10%.
Distribution of Import Volume from Various Continents
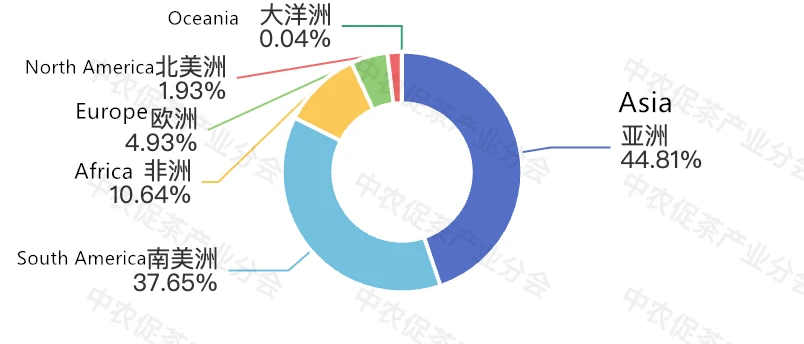
Distribution of imports from various continents
From the perspective of the main source countries, there is a clear "quantity price differentiation" in the import of tea from the United States:
Argentina ranks first in import volume with 10.07 thousand tons, accounting for 37.4% of the total, but the average price is only 1.2 US dollars per kilogram, which is a source of low-priced bulk black tea.
Japan's import volume accounts for only 4.2%, but the import value is as high as 54.8655 million US dollars, accounting for 36.2% of the total import value, with an average price of 47.93 US dollars per kilogram, far higher than other countries.
The import volume from mainland China decreased by 35.4% year-on-year, but the average price increased by 39%, indicating that the demand for high-quality tea products from China in the US market remains resilient.
In addition, the import volume of traditional black tea source countries such as India and Argentina continues to decline, putting significant pressure on the low-priced black tea market.
Overview of imports by US trading partners in Q1 2026
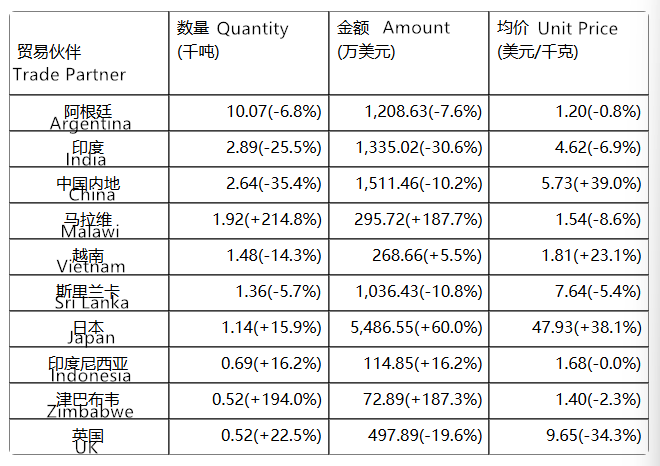
*The parentheses indicate year-on-year growth
From January to March 2026, the import of tea in the United States will show a pattern of "black tea as the main quantity and green tea as the main value", with Argentina ranking first with 37% of the quantity, and 99% of it being black tea. India and Malawi will account for 10% and 7% of the quantity, respectively, with black tea as the main component.
In contrast, although green tea in Japan accounts for only 4.2% of the total quantity, its average price is as high as $47.93 per kilogram, which is significantly higher in value than other sources. Both mainland China and Sri Lanka supply black and green tea.
Overall, black tea dominates the import volume in the United States, while green tea, although accounting for a relatively small proportion, mainly comes from high-value production areas such as Japan and mainland China.
In terms of monetary contribution, Japan ranks first with 54.8655 million US dollars, accounting for 36.2% of the total amount, with an incremental contribution rate of 267.8%, a year-on-year increase of 60.02%.
The contributions of mainland China, India, and Argentina are all negative. In terms of quantity, Argentina accounts for 37.4%, but its incremental contribution rate is -25.1%; The contribution rates of quantity increment in India and mainland China are -33.9% and -49.5%, respectively. The UAE's quantity increased by 53.3%, but its contribution to the overall is limited due to its small base.
Overall, the current import growth in the United States is mainly driven by high priced sources from Japan, while the import scale of traditional low-priced production areas has shrunk.
3. Analysis of imported tea specifications
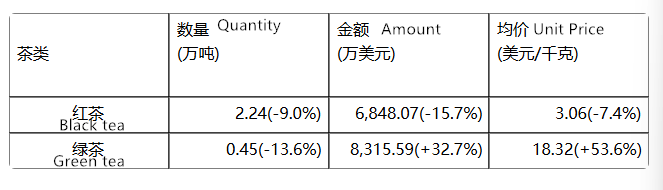
From January to March 2026, the import volume of black tea will dominate in the United States, while the import volume of green tea will account for a higher proportion. In terms of import volume, red tea imports 22400 tons, accounting for 83.2% of the total, far exceeding green tea's 4500 tons. In terms of import value, the import value of green tea reached 83.1559 million US dollars, accounting for 54.8%;the import value of black tea was 68.4807 million US dollars, accounting for 45.2%. The import value of green tea has surpassed that of black tea. In terms of price level, the average import price of green tea is $18.32 per kilogram. The import value of green tea has increased by 53.6% year-on-year, but the quantity has decreased by 13.6% year-on-year, indicating that its imports are upgrading towards high priced products; The average import price of black tea is only 3.06 US dollars per kilogram, a year-on-year decrease of 7.4%, and a year-on-year decrease of 15.7% in value, showing a trend of both quantity and price decline.
From the perspective of the sources of import increment, there is a significant difference in the contribution rate of each category to the overall import increment (i.e. the proportion of import increment of that category to the overall increment). Small packaged green tea (inner packaging ≤ 3kg) showed the most significant growth, with a year-on-year increase of 52.8% in import value, becoming the main category driving overall import growth; Green tea (inner packaging>3kg) and green tea (inner packaging>3kg, organic) both maintain rapid growth, further strengthening the trend of high-end consumption.
In contrast, the import value of black tea (inner packaging>3kg) and black tea (inner packaging ≤ 3kg, tea bags) continues to decline, which is one of the main factors causing the decline in import volume. Overall, the tea consumption structure in the United States is gradually shifting from traditional popular black tea to high value-added green tea products.
4. Analysis of Importing States
From the perspective of regional distribution, the import of tea in the United States is showing a structural feature of "mainly in the east and mainly in the west".
California was the biggest driving force for import growth this quarter, with a year-on-year increase of 46.3% in import value and a contribution rate of over 200% in incremental amount. It was mainly driven by the increase in high priced green tea imports, with an average price increase of 53.7% year-on-year. Texas' imports increased by 64.6% year-on-year, ranking first among major states in terms of growth rate. In contrast, imports in New York and Illinois decreased by 13.1% and 41.1% respectively, which dragged down overall import growth.
In terms of import volume, Georgia ranks first with 5400 tons, accounting for 20% of the country's import volume; New York State accounts for 18%; Virginia accounts for 14.2%. Traditional eastern importing states still hold the main share of tea imports in the United States, but their growth is slowing down; The western region relies on the import of high-value green tea, showing a clear trend of structural upgrading.
Overall, the US tea import market shows a clear trend of structural upgrading in the first quarter of 2026. The demand for traditional low-priced black tea continues to slow down, while high-end green tea, some organic green tea, and small packaged green tea are growing rapidly. In the future, what truly possesses competitiveness may no longer be just "low prices and scale", but quality, brand, and product value. For Chinese tea companies, green tea, high-end, small packaging, and differentiation are still directions worth paying close attention to.